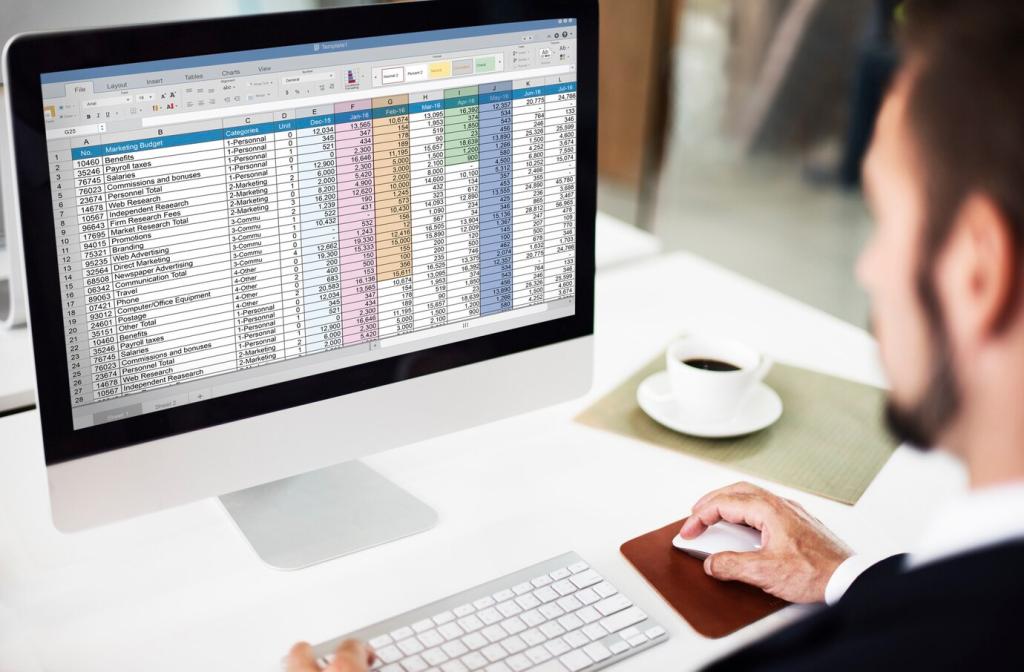
Using Excel for Budgeting and Forecasting

Set Up a Smart Budget Workbook

Design a clean sheet structure

Separate Inputs, Calculations, and Reports tabs to reduce errors. Use a monthly calendar table driving all formulas, making reconciliation and updates simple and consistent.

Name ranges and standardize categories

Create named ranges for key drivers like revenue_rate and rent, and lock a chart of accounts. Standardized categories make aggregation effortless and stop messy, inconsistent labels.

Core formulas for totals and variance

Combine SUMIFS for categorized rollups, AVERAGE for smoothing, and simple Actual minus Budget variance formulas. Highlight variances with conditional formatting to surface issues before they grow.

Forecast Cash Flow with Confidence

Build a rolling 12-month forecast

Link starting balances to monthly inflows and outflows. Use EOMONTH to advance periods, and OFFSET or INDEX to roll forward, keeping your model elegantly extensible without manual copying.

Scenario planning with Data Tables

Use What-If Data Tables to sweep key drivers like price, volume, and churn. Present two-way sensitivity results visually, helping stakeholders understand upside, base case, and downside together.

Account for seasonality and smoothing

Add month-by-month seasonality factors and multiply baseline expectations. Apply moving averages or medians to reduce noise, preserving meaningful shifts that actually require timely action.

Visualize Insights with Dashboards

Track cash runway, revenue growth, gross margin, operating expenses, and variance to budget. Define target bands and notes, so your dashboard guides decisions instead of merely decorating spreadsheets.

Data Hygiene: Trust Your Numbers

Connect to bank exports, CSVs, and SaaS reports, then transform consistently. Split columns, change types, and unpivot once. Refresh monthly with one click instead of re-cleaning under pressure.

Data Hygiene: Trust Your Numbers

Apply Data Validation lists for categories, numeric limits for rates, and input messages guiding entry. Use custom checks like ISNUMBER and EDATE to keep budget and forecast sheets sturdy and tidy.
A Real-World Story: From Chaos to Clarity

The starting mess

Maya, a freelance designer, tracked expenses across emails, screenshots, and sticky notes. Tax season felt like roulette, and late invoices strangled cash exactly when big projects finally arrived.

The turning point

She built a simple Excel budget with categories, SUMIFS, and a rolling forecast. Power Query pulled bank data weekly, and a dashboard showed runway. Confidence returned before the numbers did.

Results and lessons

After three months, overdue invoices fell sharply, and savings targets became automatic transfers. Maya reviews variances each Friday, comments on patterns, and adjusts assumptions without drama or guesswork.

Collaboration and Governance

Use OneDrive or SharePoint with permissioned folders. Publish read-only dashboards widely and limit edit access on inputs. Clear ownership prevents accidental changes and preserves accountability.

Start a clean workbook

Create Inputs, Calculations, and Reports tabs. Define categories, dates, and assumptions. Enter last month’s actuals and one realistic goal, then schedule a weekly 20-minute review on your calendar.

Build your first forecast

Set up a rolling 12-month table for income and fixed costs. Use conservative assumptions and chart the trend. Share it with a teammate and ask for one specific, practical improvement.

Join the conversation

Comment with your hardest Excel budgeting challenge or a favorite function. Subscribe for templates and deep dives, and invite a friend who wants forecasting to feel calm, not scary.
Sing-joy
Privacy Overview

This website uses cookies so that we can provide you with the best user experience possible. Cookie information is stored in your browser and performs functions such as recognising you when you return to our website and helping our team to understand which sections of the website you find most interesting and useful.